Bargraph of the development of supply of and demand for ecosystem services in the period2000-2020. The graph shows a diverse development in supply of and demand for ecosystem services in the period 2000-2020. For example, the demand for drinking water has increased, while the supply has remained stable, at around 50 percent of the demand. The demand for outdoor recreation has increased, but the supply has increased as well, to a level of 75 percent of the demand
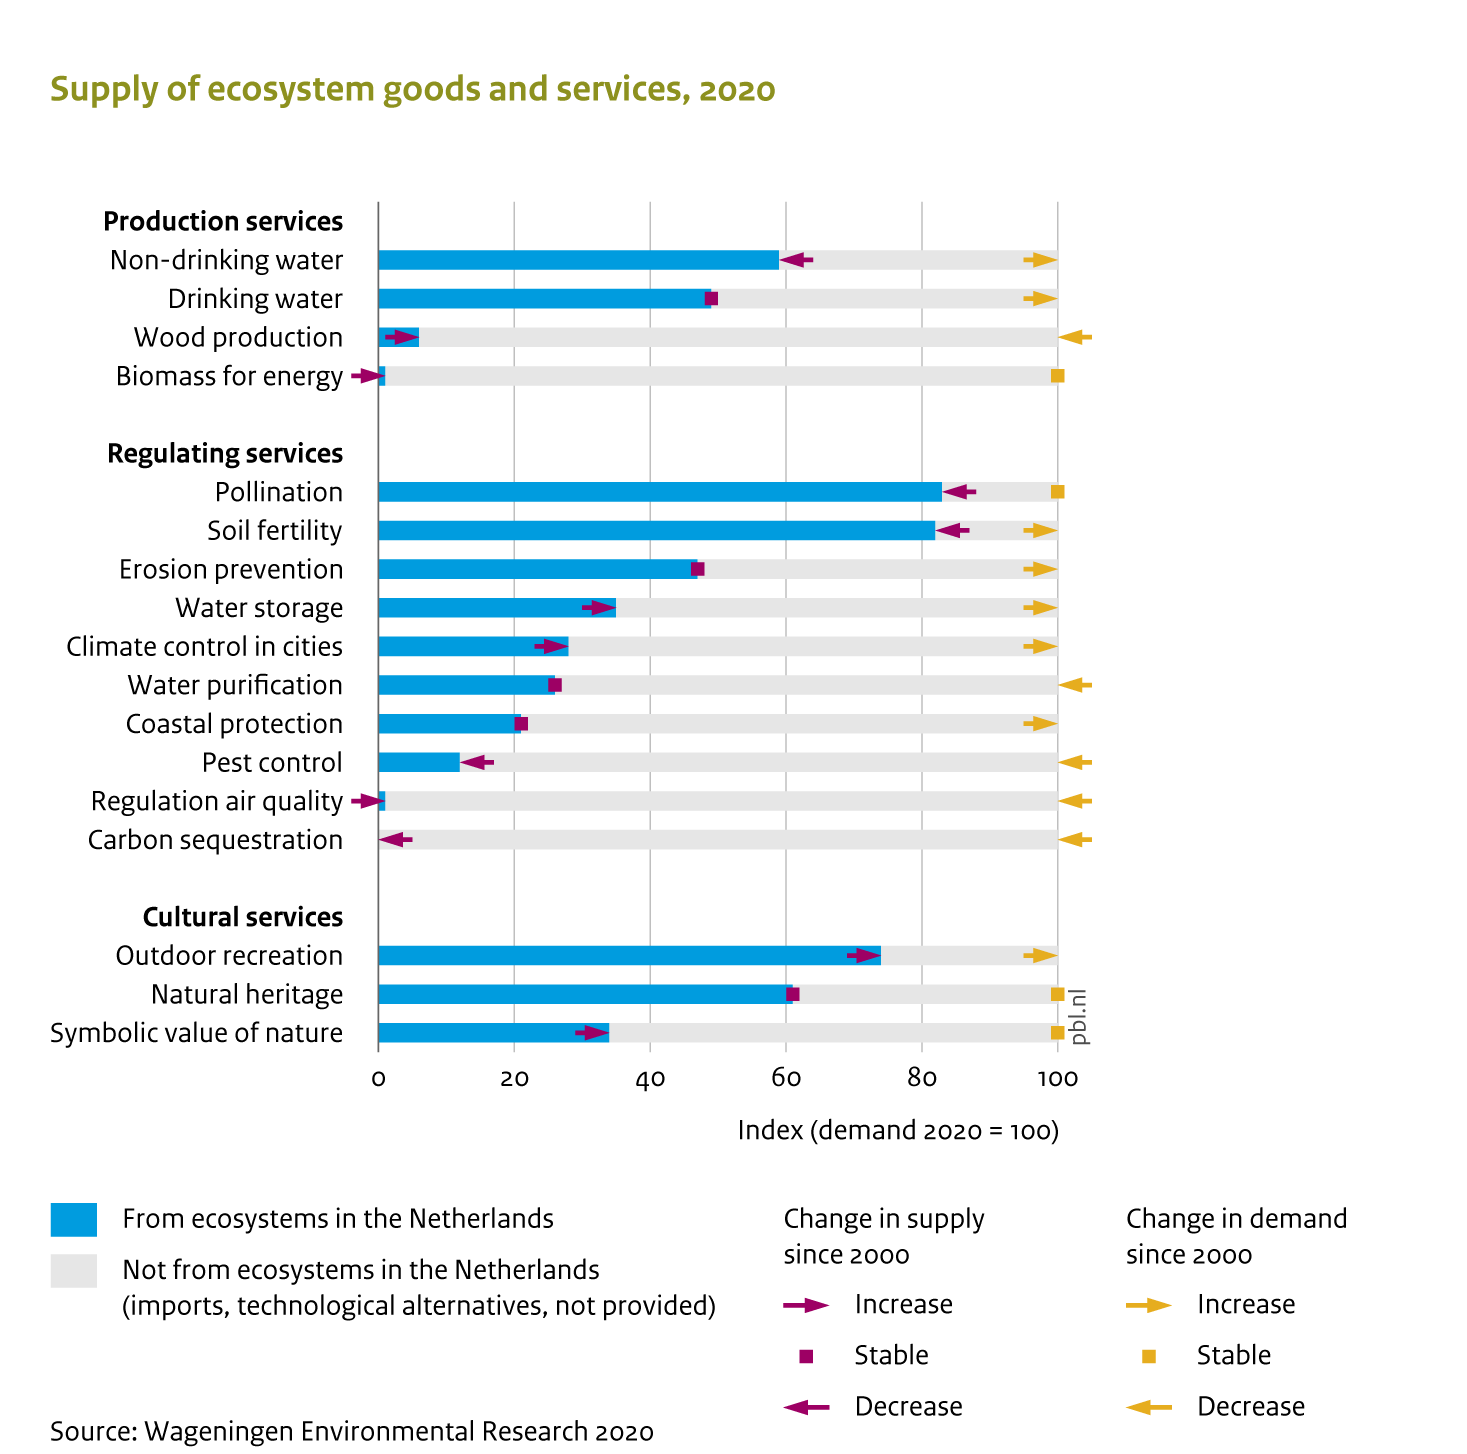
Development of supply of and demand for ecosystem services, 2000-2020