Putting Dutch ‘urban sprawl’ in a European perspective


Maarten van Schie
Researcher Spatial Processes & Modelling
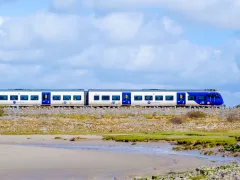
The Netherlands is the European champion for urban sprawl. This dubious honour is the result of a calculation on land-use changes since 2000 performed by the ESPON SUPER project (Sustainable Urbanization and land-use Practices in European Regions). The study was initiated in the wake of heightened attention for controlling urban development in Europe. In addition to analysing land-use data, the SUPER project is collecting experiences on how countries and regions are trying to modify their land-use practices. Next year, the project will deliver its final report which will include guidelines on how to promote sustainable urbanization.
According to the ESPON SUPER project, the Netherlands experienced the fourth highest growth in built-up areas in Europe (here defined as the European Union plus a handful of participating countries such as Switzerland, Norway and Iceland). Its 15% growth figure over the 2000-2018 period was exceeded only by Spain, Cyprus and Ireland. However, in relation to the country’s size, the Dutch top the list. It’s therefore not surprising that the European Environment Agency singled out the Netherlands as the worst offender for urban sprawl in a 2016 report. This has come as a shock for spatial planners who extol the virtues of Dutch planning as exemplary for urban containment and compact cities.
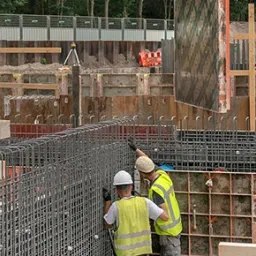
The fact that the Netherlands has built over approximately 60,000 ha of its country – 1.74% of its total surface area – over the past two decades should not come as a surprise. Spatial developments are long-term gradual processes which, long before the EEA report and the SUPER project, have been carefully monitored by the PBL Netherlands Environmental Assessment Agency. Various maps have been produced over the years providing insight into the direction and nature of urban growth. A recent example is a study on the urban fringe (PDF) that meticulously maps out urban development pressure, showing for example locations where land has been bought up by developers. It is perfectly normal that agricultural land (low value) is converted into urban land (high value) if sufficient demand exists. The fact that this conversion does not always occur is partly the product of a highly sophisticated spatial planning system: it is no simple task to buy up a farm and get permission to convert it into a business park, shopping mall or tract housing. This makes the 60,000 ha figure all the more impressive.
European benchmark
In order to put the Dutch case into perspective, the SUPER project tallied the conversion from non-urban to urban land-use over the 2000-2018 period at the European scale. The numbers for the Netherlands match domestic statistics quite well, which gives reason for confidence regarding the results. According to the analysis, the total conversion in the Netherlands (59.454 ha) was twice that of Greece (31.851 ha), but less than half that of France (188.781 ha). However, these countries are much larger. If we look at the rate of growth, the Netherlands is fourth in Europe, and when it comes to intensity, first. These results are displayed in the figures below.
Sustainable urbanization
Since 2000, about 1 million ha of land has been converted to urban use, which is roughly one third of the size of the Netherlands. It is unlikely that this will ever return to agriculture or nature. This explains the EU’s call to halt future urban development by achieving ‘no net land take’ by 2050. The Netherlands’ neighbours are already heeding this call. The region of Flanders announced it would place a 3 ha per day ceiling on development and Germany has articulated a daily goal of 30 ha. These are not the only examples: the SUPER project has collected about 200 examples of interventions (i.e. instruments, policies and strategies) designed to manage urbanization, including the Dutch sustainable urbanization procedure. These interventions fall into several general categories: containment (e.g. green belts and buffer zones), intensification (e.g. brownfield regeneration and infill) and transit-oriented development. The interventions are now being evaluated to gauge their effectiveness and sustainability.
The draft final report will be published in the spring 2020. All information regarding the progress of the SUPER project and its interim reports are all freely available on the ESPON website.
Sources linked in this article
- BBSR (2015) Das 30-Hektar-Ziel der Nachhaltigkeitsstrategie, BBSR website.
- EEA (2016) Urban Sprawl in Europe, EEA, Copenhagen.
- ESPON (2019) information on the SUPER project, ESPON website.
- European Commission (2011) Roadmap to a Resource Efficient Europe, EC, Brussels.
- Pols et al. (2018) Stadsranden schakelzones tussen stad en land, PBL, The Hague.
- Ruimte Vlaanderen (2019) Beleidsplan Ruimte Vlaanderen, RV website.