No growth in total global CO2 emissions in 2009
Despite the continued economic crisis, global emissions of carbon dioxide, the main greenhouse gas, have remained constant in 2009, as strong increases in CO2 emissions from fast-growing developing countries, such as China and India, have completely nullified CO2 emission reductions in the industrialised world.
Growth China and India compensates global reduction in CO2 emissions
In 2009, for the first time since 1992, there was no growth in global carbon dioxide (CO2) emissions from fossil fuel use, cement production and chemicals production. The recent credit crunch drove many industrialised economies into recession, particularly OECD countries and Russia, and led to a dramatic decrease in CO2 emissions of 7% in 2009 in these countries. This drop of 800 million tonnes in emissions has compensated for the continued strong increase in CO2 emissions in China and India of 9 and 6%, respectively. In the same year, emissions in other developing countries did not vary as much. These preliminary estimates have been made by the Netherlands Environmental Assessment Agency (PBL) on the basis of energy data for 2008 and 2009 recently published by BP (British Petroleum) and the International Energy Agency (IEA). The estimates are also based on production data on cement, ammonia and steel and emissions per country up to 2005 from the joint EDGAR project of the European Commission’s Joint Research Centre (JRC) and the Netherlands Environmental Assessment Agency (PBL).
Essentially no growth in global CO2 emissions from fossil fuel and cement production in 2009
After correction for the leap year 2008 and accounting for uncertainties in the data, total global emissions have essentially stabilised in 2009. Although arithmetically global emissions decreased slightly, the uncertainties estimated in the country trends and particularly in the difference of regions with growing and with decreasing emissions are such that we must conclude that the emissions have essentially stabilised in 2009. This compares with the six years since 2002 with average annual growth rates of 3.5%. In 2008, when the impacts of the credit crunch became visible, global emissions increased by about 1.5%.
This is the first time since the 1992 recession that global CO2 emissions have not increased. Previous recessions due to large increases in oil price led to global decreases in CO2 emissions in 1974-1975 and 1980-1982. In October 2009, the International Energy Agency (IEA) expected that global CO2 emissions would decrease by 2.6% in 2009. This would have been the largest drop in more than 40 years because the global recession froze economic activity and slashed energy use around the world.
However, the growth pattern has been sustained in China and India. This conclusion is based on EDGAR estimates for 1970 to 2005, IEA trends for 2006 and 2007, BP data 2007 to 2009, and other trends. This sustained growth has occurred regardless of the credit crunch that has affected most industrialised countries and is largely compensated for by the decreases calculated for the industrialised countries that have emission mitigation targets under the Kyoto Protocol.
The assessment excludes CO2 emissions from deforestation and logging, forest and peat fires, from post-burn decay of remaining above-ground biomass, and from decomposition of organic carbon in drained peat soils. The latter mostly affects developing countries. These sources could add as much as a further 20% to global CO2 emissions.

Large regional differences: China and India jump by 9% and 6% while OECD countries plummet by 7%
OECD countries
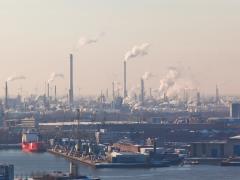
The recession in OECD countries has led to large drops in output of heavy, energy-intensive industries such as steel and basic chemicals production, oil refineries and power generation. In Europe, CO2 emissions from industries regulated by the Emissions Trading Scheme fell by 11.6% and in the USA, industry emissions from fuel combustion fell by 11% and power generation by 9%. Total emissions in the European Union (EU-15) fell by 7% to 3.1 billion tonnes and in the USA by 7% to 5.3 billion tonnes. The total CO2 emissions in Japan and Russia fell by 11% to 1.2 billion tonnes and 9% to 1.6 billion tonnes, respectively. Total CO2 emissions fell by 7% in all industrialised countries with quantitative greenhouse gas mitigation targets under the Kyoto Protocol.
China and India
Since 2000, CO2 emissions in China have more than doubled, and in India have increased by more than half. Since the end of 2008, China, has been implementing a large economic stimulus package over a two-year period. This package includes investment in transport infrastructure and in rebuilding Sichuan communities devastated by the 2008 earthquake. In 2009, CO2 emissions jumped by 9% to 8.1 billion tonnes, even though China has doubled its installed wind and solar power capacity for the fifth year in a row. India where domestic demand makes up three-quarters of the national economy is relatively unaffected by the credit crunch. Emissions continued to increase in 2009 by 6% to 1.7 billion tonnes of CO2. India has now surpassed Russia as the fifth largest CO2 emitter.
Other developing countries
The picture is more diffuse in other developing countries, ranging from countries with increasing emissions such as Iran, Indonesia and South Korea, to those with decreasing emissions, such as Brazil, Saudi Arabia, South Africa and Taiwan. In total, CO2 emissions in these countries changed very little in 2009.
Global emissions
In 2009, total global CO2 emissions had increased 25% since 2000 to 31.3 billion tonnes and almost 40% since 1990, the base year of the Kyoto Protocol. In 1990, global emissions were 22.5 billion tonnes, an increase of 45% on the 1970 level of 15.5 billion tonnes. The very large regional variation in emission trends in 2009 resulted in a 53% share of developing countries versus 44% for industrialised countries with mitigation target for total greenhouse gas emissions under the Kyoto protocol. The remaining 3% is accounted for international air and sea transport. The top-6 emitting countries, including the EU-15, comprise two-thirds of total global emissions whereas the top-25 emitting countries capture more than 80% of total emissions.
Emissions per capita
While emissions in China and other developing countries have increased rapidly in recent years, also in absolute figures, the picture is different for CO2 emissions per capita or per unit of GDP. Since 1990, CO2 emissions per capita have increased in China from 2.2 to 6.1 tonne per capita and decreased in the EU-15 from 9.1 to 7.9 tonne per capita and from 19.5 to 17.2 tonne per capita in the USA. These changes reflect a number of factors including the large economic development in China, structural changes in national and global economies, and the impact of climate and energy policies. Due to rapid economic development, per capita emissions in China are quickly approaching levels common in the industrialised countries of the Annex I group under the Kyoto Protocol. In fact, present CO2 emissions per person in China are now similar to France.
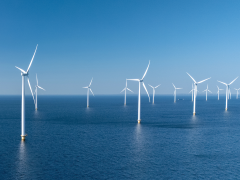
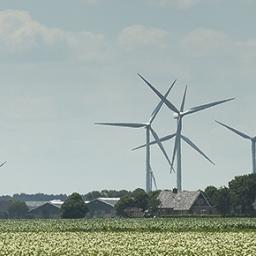
Trends in renewable energy sources
The trends in CO2 emissions include the impact of policies to improve energy efficiency and to increase the share of renewable energy sources over that of fossil fuels. Wind power capacity in the world grew 31% in 2009 (GWEC, 2010), with one-third of new installations in China. For the fifth year in a row, China has doubled its installed wind power capacity. Total solar photovoltaic power installed in 2009 is 46% up on 2008, with 70% installed in Europe which is about 50% more than in 2008 (EPIA, 2010). The USA also installed 50% more in 2009 and China doubled its installed capacity. China now leads the world in large-scale hydropower with 19% of global production, and is well before Brazil and the USA with a 12% share each. The annual increase in biofuel use in road transport of 15% in 2009 was lower than in previous years which saw about 30% increase.
Consequences for the Kyoto Protocol targets and emission trading
Collectively, the Annex I countries to the Kyoto Protocol reduced CO2 emissions in 2009 by about 7%. Assuming that the non-CO2 greenhouse gas emissions show a similar trend, the total 2009 emissions of the Annex I countries are about 10% lower than in 1990, the base year for the protocol. The decreases in 2008 and 2009 will help industrialised nations to meet their target under the Kyoto Protocol. Except for the United States, these countries are due to cut emissions collectively by an average of at least 5.2% below 1990 levels by 2008-2012. However, since a large part of the decreases is due to a freeze or drop in economic activity in response to the credit crisis, greenhouse gas emissions could rapidly increase toward pre-recession levels as industrialised countries grow out of recession.
Authors
Specifications
- Publication title
- No growth in total global CO2 emissions in 2009
- Publication date
- 1 July 2010
- Publication type
- Publication
- Publication language
- English
- Product number
- 330
Related

Quantifying the Costs and Benefits of Grid Investments to Decarbonize the European Energy Supply